The world grows richer every year. And we’ve long known that GPD per capita and Life satisfaction are strongly correlated. In fact n 2018, the UN had estimated that a 1% change in GDP per capita causes a 0.3 unit change in happiness.
I wanted to know, not if the GPD and happiness and correlated, but if as a whole the world is getting happier. And in particular if the countries that are growing the fastest are also winning at the happiness game.
Calculating a happiness score for the world
The World Happiness Report is an initiative by the United Nations that uses data the Gallup World Poll that surveys people across the world about their self-reported happiness with life. The survey question asks respondents to think of a ladder, with the best possible life for them being a 10, and the worst possible life being a 0, and to place a number in the overall satisfaction of their life.
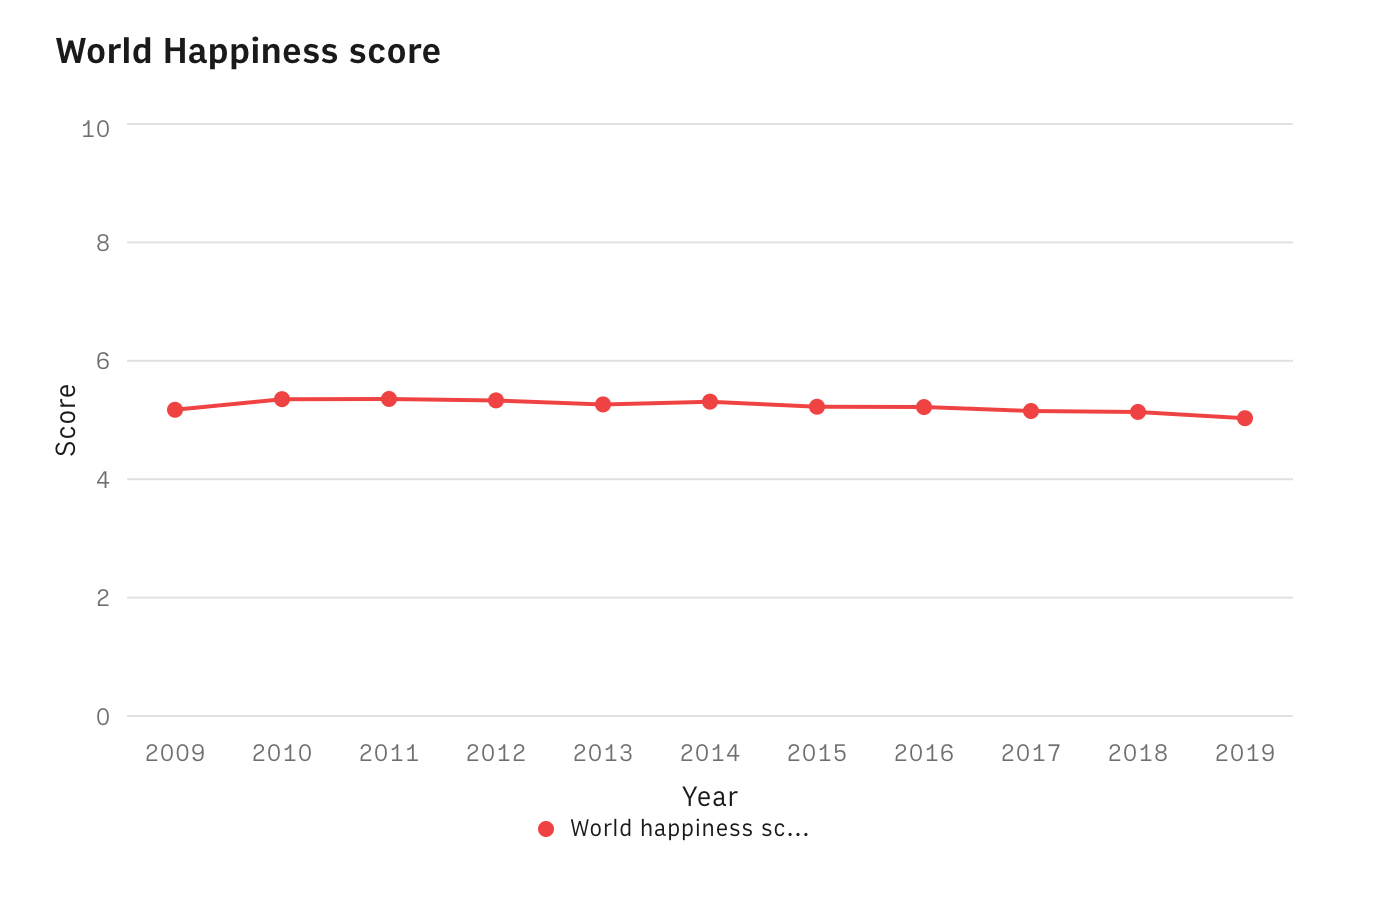
The Happiness Report is compiled per country. You can access the dataset of Happiness Reports all the way back to 2005 here. For all years between 2009 to 2019, I calculated the “World Happiness Score” as the Total Happiness Score for all countries surveyed (given by the population of that country in that year times its happiness score) divided by total population of the surveyed countries.
World Happiness Score = Total happiness score/Total population of surveyed countries
The World is not becoming happier. In fact, one can say that it is (2019) slightly unhappier (3%) that it was in the previous 10 years. I was surprised by the outcome, for 3 reasons:
The GPD per capita of the world increased by ~15% in the same period.
The Human Developed Index of the world grew by 5% in same the period.
The 2009-2013 period was the aftermath of the 07-08 financial crisis, which I expected would negatively impact self-reported happiness.
As per Wikipedia, “the Human Development Index is a statistic composite index of life expectancy, education, and per capita income indicators, which is used to rank countries into four tiers of human development.”
As for data significance and sampling bias, the population of the countries surveyed comprise >90% of the world’s population for any given year. And trusting that the Gallup World Poll surveys are in themselves statistically significant per country, nothing pointes to an obvious flaw in the analysis and its conclusion.
Analysing individual countries
Even if the world as whole isn’t getting much happier, that are certainly countries which are. In particular, I was curious about the relationships between GDP growth of the past decade and increase in self-reported happiness.
Below is the correlation between GDP per capita growth and Happiness growth (both in %) per country between ‘09-’19. With an R2 ("R squared”) is 0.075, we can see that both variables are essentially not correlated.
We also see it by analyzing individual countries. While many became happier as they grew richer - China grew 50% on GDP and 15% on happiness - others did the opposite. India is a the most glaring example, growing 59% of their GDP while reporting a decline of 28% in self-reported happiness.
The relative decline in overall happiness is driven by the fact that 7 of the 10 most populated countries in the world - that together make up 37% of the population of all surveyed countries - became less happy in the last 10 years even as all 10 grew its GPD per capital an average of 33%. The exceptions are China (+15%), Bangladesh (+1%) and Russia (+5%).
The Country Explorer
Finally, I built this Explorer where anyone can dig into any country’s evolution across all 3 metrics: GDP per capita, Happiness Score and Human Development Index.
I found it a fun way to quickly put the analysis to work.
Resources
A public Spreadsheet with the full analysis and datasets, free to use and copy.


